User Activity Profiles
1 Scatter plot of users’ daily walking activity
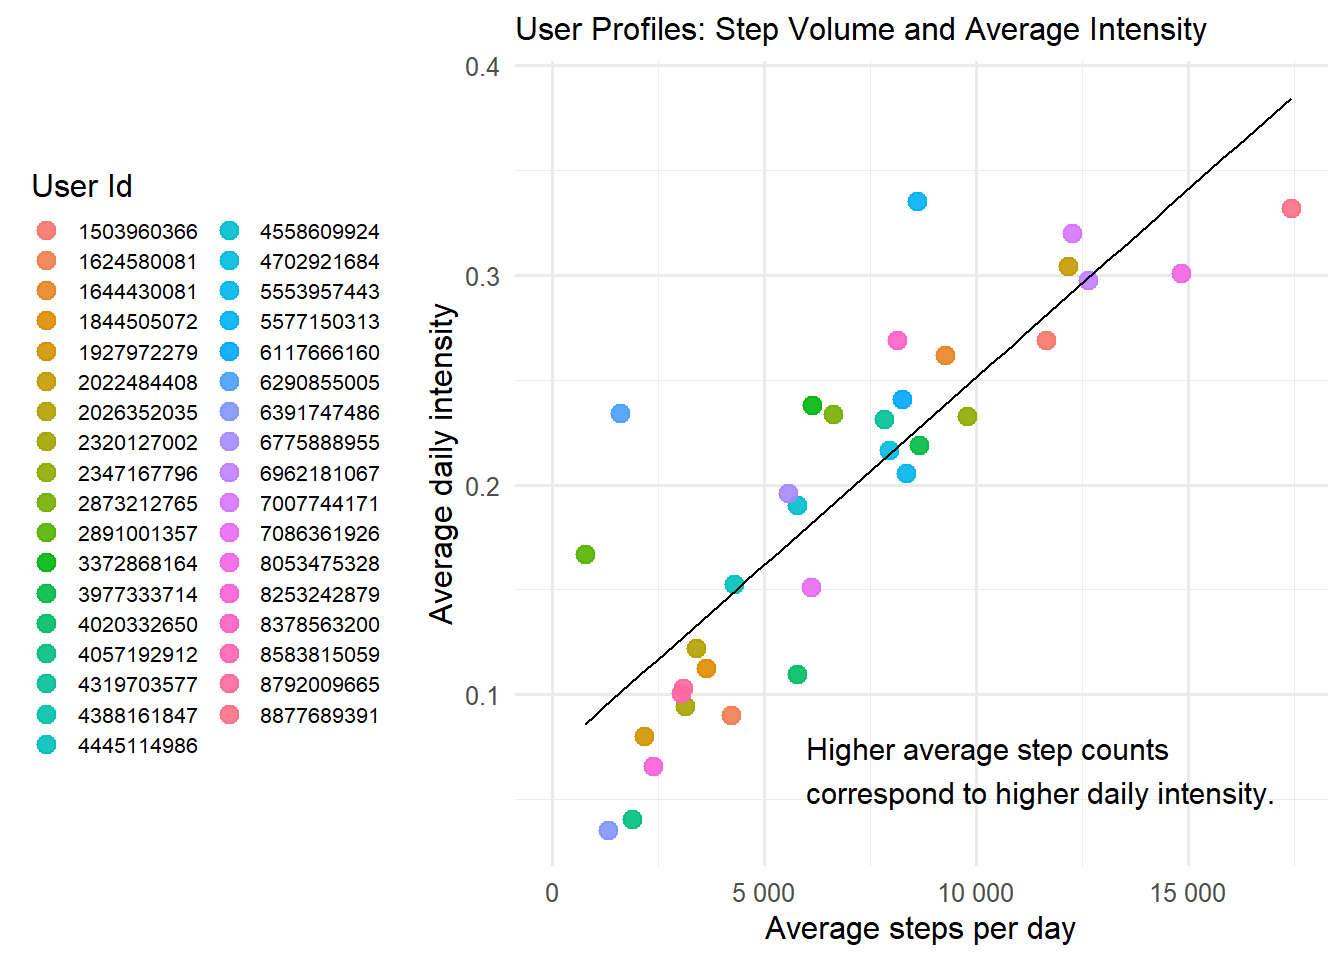
Intensity increases consistently with step volume
The chart reveals a direct relationship between step volume and average intensity: the more users walk, the higher their sustained effort. The correlation is linear: higher volume is accompanied by higher intensity, reflecting a combination of quantity and quality of effort.
A few atypical users exhibit few steps but high intensity, suggesting short but intense workouts.
The most active users combine frequent movement with sustained effort, whereas the least active users remain close to sedentary behavior.
2 Barplot: Analysis of calorie expenditure by daily intensity level
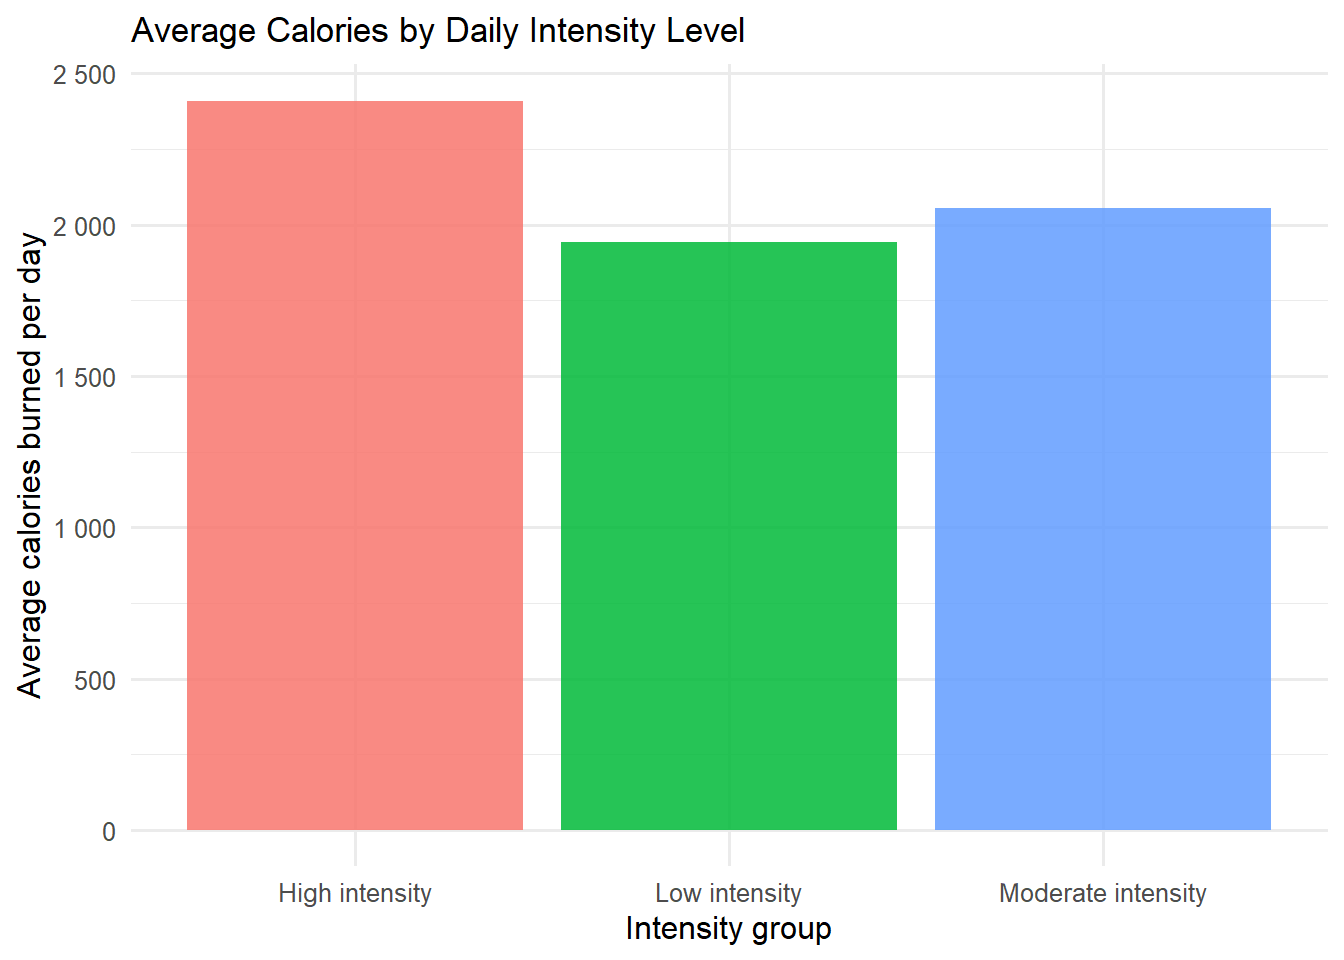
Higher daily intensity leads to higher calorie expenditure
Three levels stand out clearly:
- High intensity: ~2400 kcal/day, driven by a large volume of moderate to vigorous minutes, indicating strong physical engagement.
- Moderate intensity: ~2100 kcal/day, an active profile with fewer effort peaks, consistent with regular but not strenuous activity.
- Low intensity: ~1950 kcal/day, marked by predominantly sedentary behavior and few true effort episodes.
Intensity is therefore a key driver of energy expenditure, beyond step count. This hierarchical relationship allows segmentation of user profiles and supports recommendations encouraging more sustained effort to increase daily calorie burn.